On April 22, 2008 Shohei, John and James did a experiment lab in science class. The lab was called "Sticky Sneakers". The question for this lab was 'How does the amount of friction between a sneaker and a surface compare for different types of sneakers?' We measured three different kinds of friction by pulling shoes with spring scales until thee shoes start moving. We also did other things like our advertisements for our shoes to add to this final product. We hope you enjoy this sticky sneaker blog!
Materials
- Spring scales (to measure friction)
- Duck tape (or any other strong tape)
- Three paper clips
- Three different type of shoes
- Scale (to measure weight of shoes)
- Weights (to make shoes to 500g)
Procedure
Shohei, John and James got three types of shoes. The shoes they used was a basketball shoe, a running shoe and a walking shoe. First in their procedure, they taped a stretched-out paper clip to the front, back, and side of one of the shoes. To make the friction by mass even, they also put weights in the shoes to make each shoe 500g. Next, they hooked on a spring scale onto on of the paperclips. One person slowly pulled harder and harder on the scale until the shoe started to move. When it did, the others took the amount of newtons used to pull the shoe according to the scale, and that was the way they gathered our data for the shoe. These steps were repeated until all sides were done.Next, their group taped up the second and third shoe and gathered data for those types also. After all of the data gathering, all they had to do was average the friction. Shohei, John and James added all of the numbers, for a shoe in a type of friction and then divided it by number of the trials (three). When they were done with the data gathering, that was the end of their procedure.
This is our action video of us doing our sticky sneakers lab.
Data Table
We made this data table according to our lab. As you can see their are three types of shoes and three types of friction.
 Variables and Analysis
There are mainly two type of variables in this lab; the manipulated variable and the responding variable.
The manipulated variable is the variable we change on purpose. We change the type of shoe to do our lab. If we did not change the shoe there would not be much meaning of this lab about our sneakers. The responding variable is the thing that changes because of our manipulated variable. Our responding variable in this lab is the amount of friction for each shoe. Because we change the shoe, the friction changes. When you have a manipulated variable affecting something we are measuring, there must be responding variable changing the data table like the one above.
The sticky sneakers experiment may be called a controlled experiment. This means that only one factor in the experiment is changed. Then it is easier to see what caused the difference of friction because there would only be one change.
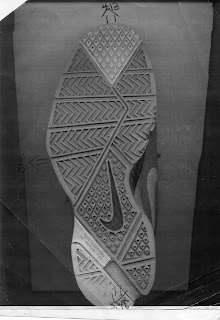
Looking at our data table, we found a couple patterns in our data table. One was that the walking shoe, which has more of the sole touching the ground, had more friction. The running shoe and basketball shoe had more cushion and less of the sole touching the ground. Also we found that the sideways stopping friction was less than the other types of friction. This may have been because the shoe is longer forward to back and maybe the sideways isn't as stable.
We think that the experiment may be changed by changing the surface under the shoe instead of changing the shoe itself. Then you will only need one shoe. Also finding three surfaces is not very hard. For instance we could use a cement floor, a wooden table, and asphalt outside. There could still be many more variations to this experiment.
Shoe Patterns


Shoe Advertisements
We also did a shoe article on our shoes to explain how the shoe would be useful in life. We showed our shoe by drawing diagrams. Our group did our best to make the advertisements realistic.


Conclusion
Our conclusion was that the walking (VANS®) sneaker had the most friction in all areas. This may be because of the grip on the bottoms of all of the shoes. The walking shoe was fairly new, the others may have been old and had been worn out over time. Another possible error, was that we may have pulled at different strengths while pulling of the Newton spring scales and that the scales may have been inaccurate. Also, on the running and basketball shoes, not all of the sole of the shoe was touching the ground. However all the parts of the sole of the walking shoe was touching the ground. Any of those problems could have easily disrupted our experiment.
When we tested the walking shoe, our hypothesis was that it was going to be harder to pull. We thought it would have the most friction, and that the basketball or running shoe would have less because of the different amount of the sole touching the ground. But according to the results we were correct.
Lastly, after our testing we learned that when pulling the shoes they should be a position when in used to see what the friction is in everyday life. If they pulled with the shoe tilted the shoe would not be in position and the friction could change greatly.